What do the indicators mean in VKontakte statistics?
Let's start with the basics (by the way, these are the basics of media planning - if you want to learn more, you know what to Google).
Impressions - The total number of times your post was shown. All views are counted here, that is, one user is “recorded” in this indicator several times.
Reach is a metric that measures the number of people who saw your material. Reach only evaluates unique users. That is, how many people have you reached? We have already written in more detail about coverage in a separate article.
In addition, VKontakte statistics contain information about four types of coverage:
Total coverage is the total number of all users reached (the sum of the three parameters listed below).
Subscriber reach is the number of users who saw the post and are at the same time subscribed to the community.
Viral reach is the number of users who saw the material, although they are not subscribed to the community (for example, they saw a repost on a friend’s page or received a post in personal messages).
Advertising reach - users reached through paid promotion.
What happens if the secret limit is exceeded?
If you skip the captcha, enter the wrong characters, or continue to like at a breakneck speed, the page will be frozen. When you try to open VK, this nasty window will appear on your computer monitor:
If the situation with an abundance of likes repeats 2-3 times, VKontakte moderators will intervene. And these guys will freeze the page manually for a certain period of time (week, month).
Your task when putting mass likes is to hide the fact of cheating by pretending to be an active network user. You can bypass the restrictions of the anti-bot system in the following ways:
- Every 15-20 likes, take a break for 10 minutes.
- Dilute liking with other actions on VK: writing messages, leaving comments, watching videos, reposting.
- Enter the captcha carefully, without making mistakes.
With a competent approach to business, you can give as many likes as you like. Even if we take into account unofficial rumors about the allowed 500 hearts, this limit is enough for you to earn money.
It would also be a good idea to read the information in the article: “How to get likes on a post and not lose access to your account.”
How to view VKontakte community statistics
There are two convenient ways to view page statistics:
- Built-in VKontakte statistics (your own accounts);
- Using an analytics service on social networks (your own and other people’s pages).
VKontakte pages and groups have the same statistics, so let’s agree - we’ll tell you about everything at once.
The simplest numbers can be obtained directly on the community page: the number of views, likes, comments, reposts of publications, the number of subscribers. This data is visible to all users.
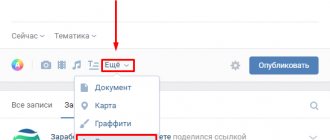
For more detailed statistics, go to the "Community Management - Statistics" section.
By default, detailed VK statistics are available only to administrators, but they can be opened to everyone. This function is used by public owners who sell advertising: open statistics prove that posting in the community will be effective.
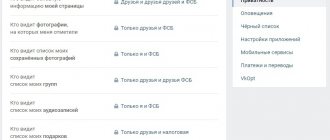
To change access to community statistics, scroll to the bottom of the statistics page, where the “Who can access community statistics” block is located there.
Here you will see sections:
- Coverage;
- Attendance;
- Activity;
- Community messages;
- Records.
The “Reach” and “Attendance” sections contain graphs that can be displayed by day, week or month and select the desired time interval.
Below is information about the audience in question:
- Gender/Age;
- Geography;
- Devices (mobile/computers).
The “Activity” section displays information about user actions:
- Subscribe to notifications about new posts in the community.
- Engagement indicators: Likes; Comments; Reposts; Hiding community posts from the feed;
- Activity in photo albums;
- Participation in discussions.
The “Community Messages” section collects information about correspondence with the page. Even if you don't have the Community Posts widget connected, you can still see information about user requests to yours on your community page.
There are two graphs available here:
- Unique users who sent messages;
- Number of messages sent and received.
Post statistics are available for communities with more than 5,000 members. By default, this data is not collected. When you first enter this section, click on the “Enable advanced statistics” button.
Unlike other statistics sections, detailed recording statistics are visible only to administrators and editors, even if you have opened the statistics to everyone in the settings.
The “Posts” section displays data about each community post. On the site you can see statistics about the last 150 publications, and in the download - about 300.
When you delete a post, its statistics also disappear.
In the "Posts" section you will see:
- Total reach and subscriber reach;
- Likes;
- Reposts;
- Comments.
In the hiding tab: Number of times the entry has been hidden. Complaints. Hiding all entries.
In the transitions tab: The number of people who transferred to the community, joined the community and clicked on the link. Number of introductions from this entry. Number of clicks on the link.
Data is updated every 10 minutes.
Why is the information not available?
Analytical data is not available to everyone. Why are there no VK statistics for some users? Accounts with a small number of subscribers are not taken into account by the system. If you do not have 100 subscribers, then it is impossible to get detailed data about your profile. The necessary information can be viewed at https://vk.com/feed?section=notifications&w=stats by adding the page id. However, the amount of information will be limited.
How to make statistics in VK and get a detailed report? You need to collect the minimum allowed number of subscribers. Then you can use the above methods.
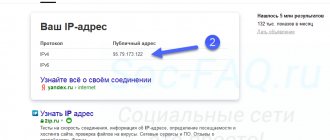
Uploading VKontakte community statistics
Statistics can be downloaded in xls or csv format and analyzed on a computer. To download VKontakte page statistics, click the “Download statistics” button (in the upper right corner).
A window will open with a choice of parameters:
- Upload format;
- Time interval;
- Type of data to export (community statistics or post statistics);
- Data types.
By default, statistics are downloaded by day. To analyze data for a month at once, create a pivot table.
Statistics on records in the upload are more detailed than in the account. Displayed here:
- Date of publication;
- Post author;
- Full text of the entry;
- Link to post;
- Coverage: subscribers, viral, advertising, full;
- Number of likes;
- Number of reposts;
- Number of comments;
- Number of hides;
- Number of complaints;
- The number of hides of all community posts;
- Transitions to the community;
- Community subscriptions;
- Transitions via external links.
How to remove extra likes?
And where do hearts from dubious personalities appear on the VKontakte page? Don't worry, this doesn't mean surveillance. It’s just that someone makes money by giving likes to the target audience from fake accounts. If after 2-3 days the “fan’s” portrait turns into a dog, this is 100% cheating.
Extra likes can be deleted in a couple of clicks:
- Hover your mouse over the heart.
- A pop-up window appears “Like it?? people" with fan avatars. Click on it.
- Hover your cursor over the avatar of the person whose like you want to remove. A small cross will appear in the upper right corner:
- Click "Block". Now a warning window will appear:
- Select the “Continue” button. Just don’t delete your friends’ likes out of resentment, unless, of course, you want to completely quarrel.
You can find out in more detail whether your likes are cheated or not, using the article: “In what cases do you need to check a VK like for cheating, and how to do it?”
Now you know that the VK likes limit is not a hard and fast rule, but rather a reasonable framework that protects users from spam. The anti-bot system is easy to bypass, and it takes a maximum of 3 minutes to restore a page after freezing. The main thing when making money from likes is to give up greed and haste.
[Total: 2 Average: 5/5]
Author of the publication
offline 2 years
Amely
Comments: 0Publications: 404Registration: 05-10-2018
Analysis of personal VKontakte page
All users who gain more than 100 subscribers have access to the statistics of their personal VK page. Yes, you can simply unfriend users who raise the question “Who is this anyway?” (We're sure everyone has one of these).
The link to the community page is located under your profile photo.
Statistics for a personal page on VKontakte are similar to group statistics, but in an abbreviated version. There are only three sections here:
- Coverage;
- Attendance;
- Activity.
Similarly with community statistics, you can see the reach of subscribers and the socio-demographic characteristics of your audience, as well as the country and city (from the profile on VKontakte), where they live, and what devices they use to visit the social network.
The “Attendance” tab contains data on subscriptions and unsubscribes to your page. Data can be displayed for a day or for all time. At the same time, by moving the window under the graph, you can change the time interval for which statistics are displayed.
On the “Activity” tab, you can evaluate the popularity of your content on VKontakte: the number of likes, comments, reposts and hides.
It also displays the number of users who have turned on notifications about your new posts - this means that they do not want to miss your posts, even if the algorithms do not show them in the news feed.
Personal page statistics can be exported , this works in the same way as exporting community statistics.
VK limits on the number of likes per day
Let’s immediately reveal a terrible secret: there is no limit on likes on VKontakte. On the Internet, there are loud statements that you cannot bet more than 500 pieces per day.
But there are two nuances here:
- The information is unofficial.
- It is refuted by the experience of people who gave 600-1000 likes and were not subject to sanctions.
However, it is not so much the number of likes that is important as the line of behavior. VKontakte operates a strict supervisory anti-bot system. It fights fraud, spam, and at the same time prevents honest people from making money. If you don’t know how to deceive her, you will face a problem with up to 100 likes.
How to understand that Antibot is interested in you? A captcha will start to appear on the screen. This can happen after 20-30 likes:
Statistics of any VKontakte page
We have dealt with analyzing the statistics of our own pages and communities. Now let’s learn how to look at the statistics of other people’s pages: competitors or public pages where you plan to buy advertising.
In order to view statistics of communities and pages on VKontakte, to which you do not have access, use. You will even receive data that is not included in the built-in community statistics.
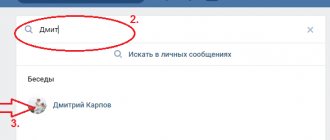
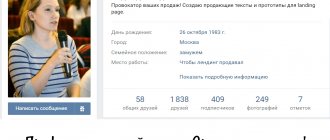
Let's take a look at the statistics of the Amediateki community together. We entered the address into the search bar and selected the analysis dates: let it be a month, from April 15 to May 15.
A dashboard with 3 columns will open:
Statistics
Here you can select graphs based on different parameters : activity in the community by day of the week and time of day, likes, comments, views, reposts, ER, subscriber growth. And also: the volume of text, the number of publications, the ratio of audience activity and the length of the text and publication formats (photos, videos, text). Read more about each indicator in the FAQ.
Ribbon
This column contains all community publications for the selected period .
Using the example of Amediateka, it can be seen that the most popular post is the announcement of the series “Patrick Melrose” (surely the secret of success is Benedict Cumberbatch!).
By default they are sorted by number of likes , but you can choose any other option. For example, to determine the most engaging topics among your competitors, sort posts by comments.
Name
The third column displays general information: the number of likes, comments, views, reposts for the period, ER (engagement rate). This section is marked with a red arrow in the screenshot above.
There is also a button for downloading all publications from the feed to Excel. Posts are exported along with text, images, and detailed statistics for each post.
When you click on the “Show table” button, a summary for the selected period opens. It is convenient to insert into presentations or show to a client. 
The full analysis result can also be uploaded to XLSX, PPTX or PDF. The download button is located on the left, in the “Statistics” column.
Now you can analyze your competitors’ VKontakte statistics using Excel, if this is more convenient. Or create detailed reports with VK community statistics for your clients in a couple of minutes.
How to restore a frozen VK page?
It's quite easy to do this:
- Enter the mobile phone number to which the page is linked in the bottom box.
- Click on the “Get code” button. The service is free.
- When the code arrives via SMS, you will only have to enter the numbers in a separate window.
The VKontakte page has been restored. Exactly the same actions are performed if the account is frozen for a certain period. You'll just have to wait. You can write a request to the support service, but practice shows that only a few succeed in achieving early defrosting of the page.
Do not install dubious VK page recovery programs on your computer. These are viruses and Trojans designed to steal data and extort money.
And if Instagram blocked the likes, then you can find out why this happened by following the link.
So:
- On VKontakte you can view community statistics: users reached, post statistics, socio-demographic characteristics of the audience, detailed post statistics.
- Access rights can be managed: open it only to community administrators or to everyone (for example, to sell advertising in the community). But only administrators can see record statistics.
- VKontakte personal page statistics are available for users who have more than 100 subscribers.
- Both community statistics and personal page statistics can be downloaded.
- Popsters can analyze other people's VKontakte communities. It displays data about each post and the dynamics of the community, and the report results can be downloaded.
Purposes of monitoring group activity – why study?
First of all, it is necessary to track activity in order to understand which audience is most involved in the life of the community (age, gender, geography, etc.). Having this information helps improve the quality of further attracting people. That is, you, as a manager, when setting up a target for your advertising, know by what criteria to look for your target audience.
Secondly, it gives an understanding of which posts get the most impact. This is no less important information. It makes it possible to improve the quality of published content and know in which direction to develop further.
For example, you decided to experiment and publish mostly entertainment content for a week. You wanted to understand how your audience would react to this. After a week (or maybe earlier), you look at the activity statistics and, based on the results, draw appropriate conclusions and take further measures.