What do the indicators mean in VKontakte statistics?
Let's start with the basics (by the way, these are the basics of media planning - if you want to learn more, you know what to Google).
Impressions - The total number of times your post was shown. All views are counted here, that is, one user is “recorded” in this indicator several times.
Reach is a metric that measures the number of people who saw your material. Reach only evaluates unique users. That is, how many people have you reached? We have already written in more detail about coverage in a separate article.
In addition, VKontakte statistics contain information about four types of coverage:
Total coverage is the total number of all users reached (the sum of the three parameters listed below).
Subscriber reach is the number of users who saw the post and are at the same time subscribed to the community.
Viral reach is the number of users who saw the material, although they are not subscribed to the community (for example, they saw a repost on a friend’s page or received a post in personal messages).
Advertising reach - users reached through paid promotion.
How to collect statistics? TOP best services
Let us immediately note that most services for collecting information from VK pages are paid, but you get graphic and understandable results that are used for promotion and advertising.
So, the top 5 best services:
- Popsters will cost at least 400 rubles per month, analyzes any pages, even if you are not an admin, helps identify pros and cons, compares, sorts information, helps identify the most interesting publications.
- SocialStats works for free, tracks popular publications, and analyzes media content. But it does not always work stably and does not analyze competitors.
- LiveDunePro will cost 1,900 rubles, helps you find suitable sites for advertising, you can monitor the activities of competitors, analyzes hashtags, but analytics are not enough.
- JagaJam is suitable for full and in-depth analytics; it breaks information into categories, has daily data updates, and creates a ready-made report on the activities of a community or page.
- AllSocial works free of charge, is ideal for simple analysis and assistance in media planning, has a page rating, collects data on all users, and displays links to the most popular competitors.
How to view VKontakte community statistics
There are two convenient ways to view page statistics:
- Built-in VKontakte statistics (your own accounts);
- Using an analytics service on social networks (your own and other people’s pages).
VKontakte pages and groups have the same statistics, so let’s agree - we’ll tell you about everything at once.
The simplest numbers can be obtained directly on the community page: the number of views, likes, comments, reposts of publications, the number of subscribers. This data is visible to all users.
For more detailed statistics, go to the "Community Management - Statistics" section.
By default, detailed VK statistics are available only to administrators, but they can be opened to everyone. This function is used by public owners who sell advertising: open statistics prove that posting in the community will be effective.
To change access to community statistics, scroll to the bottom of the statistics page, where the “Who can access community statistics” block is located there.
Here you will see sections:
- Coverage;
- Attendance;
- Activity;
- Community messages;
- Records.
The “Reach” and “Attendance” sections contain graphs that can be displayed by day, week or month and select the desired time interval.
Below is information about the audience in question:
- Gender/Age;
- Geography;
- Devices (mobile/computers).
The “Activity” section displays information about user actions:
- Subscribe to notifications about new posts in the community.
- Engagement indicators: Likes; Comments; Reposts; Hiding community posts from the feed;
- Activity in photo albums;
- Participation in discussions.
The “Community Messages” section collects information about correspondence with the page. Even if you don't have the Community Posts widget connected, you can still see information about user requests to yours on your community page.
There are two graphs available here:
- Unique users who sent messages;
- Number of messages sent and received.
Post statistics are available for communities with more than 5,000 members. By default, this data is not collected. When you first enter this section, click on the “Enable advanced statistics” button.
Unlike other statistics sections, detailed recording statistics are visible only to administrators and editors, even if you have opened the statistics to everyone in the settings.
The “Posts” section displays data about each community post. On the site you can see statistics about the last 150 publications, and in the download - about 300.
When you delete a post, its statistics also disappear.
In the "Posts" section you will see:
- Total reach and subscriber reach;
- Likes;
- Reposts;
- Comments.
In the hiding tab: Number of times the entry has been hidden. Complaints. Hiding all entries.
In the transitions tab: The number of people who transferred to the community, joined the community and clicked on the link. Number of introductions from this entry. Number of clicks on the link.
Data is updated every 10 minutes.
Alien community
We have the answer to how to view the statistics of someone else’s VK group! The service https://popsters.ru will come to the rescue. The interface is clear even to a beginner:
- Select a social network from the list;
- Find the public you are interested in in the search;
- Open tabs with the desired statistics.
Important! The service allows you to work only with those pages whose administrators have not hidden the ability for other users to view them.
The second way is even simpler:
- Open VKontakte and copy the group ID (in the address bar);
- Go to a new tab and enter the address https://vk.com/stats?gid=;
- After the equal sign, insert the copied ID.
We have described in detail how to find out the statistics of a VK group - now convenient data analysis tools will always be at hand!
Uploading VKontakte community statistics
Statistics can be downloaded in xls or csv format and analyzed on a computer. To download VKontakte page statistics, click the “Download statistics” button (in the upper right corner).
A window will open with a choice of parameters:
- Upload format;
- Time interval;
- Type of data to export (community statistics or post statistics);
- Data types.
By default, statistics are downloaded by day. To analyze data for a month at once, create a pivot table.
Statistics on records in the upload are more detailed than in the account. Displayed here:
- Date of publication;
- Post author;
- Full text of the entry;
- Link to post;
- Coverage: subscribers, viral, advertising, full;
- Number of likes;
- Number of reposts;
- Number of comments;
- Number of hides;
- Number of complaints;
- The number of hides of all community posts;
- Transitions to the community;
- Community subscriptions;
- Transitions via external links.
How to upload (download) statistics to your computer?
It is worth noting that this data is available only to you; it is impossible to provide (share) access to information about statistics to other users, only if you decide to give access to your account or send screenshots of indicators to the right people.
- But you can download statistics by clicking on the corresponding button:
- Here you can select the types of data you want to see in your report, select the period for which it will be generated, and the file format. After that, click on “Get data”.
- Save the document to your computer;
- The data will be available in an Excel document and will look like this:
Analysis of personal VKontakte page
All users who gain more than 100 subscribers have access to the statistics of their personal VK page. Yes, you can simply unfriend users who raise the question “Who is this anyway?” (We're sure everyone has one of these).
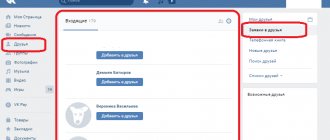
The link to the community page is located under your profile photo.
Statistics for a personal page on VKontakte are similar to group statistics, but in an abbreviated version. There are only three sections here:
- Coverage;
- Attendance;
- Activity.
Similarly with community statistics, you can see the reach of subscribers and the socio-demographic characteristics of your audience, as well as the country and city (from the profile on VKontakte), where they live, and what devices they use to visit the social network.
The “Attendance” tab contains data on subscriptions and unsubscribes to your page. Data can be displayed for a day or for all time. At the same time, by moving the window under the graph, you can change the time interval for which statistics are displayed.
On the “Activity” tab, you can evaluate the popularity of your content on VKontakte: the number of likes, comments, reposts and hides.
It also displays the number of users who have turned on notifications about your new posts - this means that they do not want to miss your posts, even if the algorithms do not show them in the news feed.
Personal page statistics can be exported , this works in the same way as exporting community statistics.
What do VKontakte statistics show?
First of all, you will see a graph of traffic to your page.
In it you can see two lines: unique users and views. The first means that another person has visited and viewed information from your page. Views mean that the user received the post or photo through the “My News” tab. The data on it is updated every day. In general, the data that is available through this service is similar to that provided by the statistics of the VKontakte group. Below the schedule of visits and views you have access to the following characteristics:
- gender and age;
- a country;
- city;
- from which devices your page is visited;
- subscriber changes.
If you want to make your page popular and perhaps even make money, then all this information will be very interesting to you. There are several programs with which you can artificially increase the number of subscribers. This is enough to get statistics, but it will not add popularity to you. To ensure that the views tab is not empty, as is usually the case with ordinary pages, you need to post interesting posts, photos and other content. It is important to find subscribers yourself. To do this, you need to leave comments in public pages and groups. If they are interested in you, then the VKontakte statistics will improve. Your statements must be original and attractive for this. Popularity is easy to gain and lose. The statistics of the VKontakte groups with which you interact also affect your success.
Statistics of any VKontakte page
We have dealt with analyzing the statistics of our own pages and communities. Now let’s learn how to look at the statistics of other people’s pages: competitors or public pages where you plan to buy advertising.
In order to view statistics of communities and pages on VKontakte, to which you do not have access, use. You will even receive data that is not included in the built-in community statistics.
Let's take a look at the statistics of the Amediateki community together. We entered the address into the search bar and selected the analysis dates: let it be a month, from April 15 to May 15.
A dashboard with 3 columns will open:
Statistics
Here you can select graphs based on different parameters : activity in the community by day of the week and time of day, likes, comments, views, reposts, ER, subscriber growth. And also: the volume of text, the number of publications, the ratio of audience activity and the length of the text and publication formats (photos, videos, text). Read more about each indicator in the FAQ.
Ribbon
This column contains all community publications for the selected period .
Using the example of Amediateka, it can be seen that the most popular post is the announcement of the series “Patrick Melrose” (surely the secret of success is Benedict Cumberbatch!).
By default they are sorted by number of likes , but you can choose any other option. For example, to determine the most engaging topics among your competitors, sort posts by comments.
Name
The third column displays general information: the number of likes, comments, views, reposts for the period, ER (engagement rate). This section is marked with a red arrow in the screenshot above.
There is also a button for downloading all publications from the feed to Excel. Posts are exported along with text, images, and detailed statistics for each post.
When you click on the “Show table” button, a summary for the selected period opens. It is convenient to insert into presentations or show to a client. 
The full analysis result can also be uploaded to XLSX, PPTX or PDF. The download button is located on the left, in the “Statistics” column.
Now you can analyze your competitors’ VKontakte statistics using Excel, if this is more convenient. Or create detailed reports with VK community statistics for your clients in a couple of minutes.
We work with our public
VK community statistics are easily accessible - you don’t have to search for data for a long time or delve into the settings. To view the information you need, do the following:
- Discover the social essence;
- Login to the public page;
- Under your avatar, find an icon with the same name.
Done, the public statistics on VK have opened in front of you. You can view the data in two ways:
- Online on the website;
- Download to your computer in table format.
To download the information you will have to do the following:
- Click on the “Upload” button in the upper right corner;
- Select saving format;
- Specify time range;
- Select the types of data to be uploaded;
- Click on the “Get” icon.
Ready! We were able to obtain the necessary data - now we need to figure out how to conduct a qualitative analysis of the VK group and communities according to the main indicators.
So:
- On VKontakte you can view community statistics: users reached, post statistics, socio-demographic characteristics of the audience, detailed post statistics.
- Access rights can be managed: open it only to community administrators or to everyone (for example, to sell advertising in the community). But only administrators can see record statistics.
- VKontakte personal page statistics are available for users who have more than 100 subscribers.
- Both community statistics and personal page statistics can be downloaded.
- Popsters can analyze other people's VKontakte communities. It displays data about each post and the dynamics of the community, and the report results can be downloaded.
Finally
The ability to view statistics of a personal VKontakte page allows you to assess how interesting it is to network users. From this article it is clear that this function provides a wide range of tools, the use of each of which can be useful in solving different problems. In other words, for everyone there will be a section that will be most interesting to them.
For example, a professional photographer uploading his work to a page will find the most interesting graphs shown in the “activity” section. After all, such a person will be interested in receiving more o. Using this tool will give him the opportunity to evaluate how relevant his work is.
For those who trade anything through a social network, it will be most useful to know your audience. He needs this in order to be able to form the composition of his future customers. The sections of the “attendance” tab will help him with this.
Tabs with information about your personal page
In total, there are three tabs with information, each of which I will now talk about.
Coverage
The “Reach” tab allows you to find out all the ins and outs of your subscribers.
The first graph shows who is viewing the profile. These are people who not only saw some post, but went to the page and studied it.
There are two indicators:
- Full coverage;
- Subscriber coverage.
Total coverage is calculated from the sum of subscribers and unique visitors. As can be seen from the graph, on July 14, the page was viewed by 22 people, 9 of whom are subscribers.
Typically, when buying advertising, subscriber reach is the most important metric. The higher it is, the more money you can request for placing an advertising post.
Scrolling below you can find graphs that will help you decide whether the target audience is present on a given page or not.
Gender/Age/Geography/Cities/Devices - all this is information about the people who viewed the page.
Uniqueness
This tab will show the number of unique visitors and the total number of views. Information is updated daily.
As with reach, there is an audience distribution by gender, age, geolocation and device. This helps to determine how many times a day a profile is viewed and how many of the visitors are unique.
Activity
This tab allows you to track how many people view posts, how many likes or reposts. Quite popular information, especially for those who promote a page with the aim of later earning money. It helps analyze audience engagement and activity.
How to use statistics to bring your page to the top?
Why are those statistics needed? Without it, it is impossible to see your mistakes and improve the content and quality of the material. Since the information will show which posts are the most popular, which audience is “yours”, when is the best time to publish, at what moments are more subscribed, who views the account more often. By improving each indicator (depending on the topic and the desired final goal), you can get to the TOP of the search engine. And this attracts even more subscribers and advertisers (and therefore you will earn more money).
Plus - almost every advertiser or affiliate program will ask for statistics in order to understand what to expect and whether it is worth doing business with you.
Read about how to use VK group statistics for successful promotion in the corresponding article.
Conditions for access to VKontakte traffic statistics
As noted above, the only condition that a user’s page must meet is the presence of more than one hundred subscribers. It is important to note that people who are friends do not belong to this category: if there are more than a hundred friends, and only 90 subscribers, the user will not be able to go to the statistics section, since he simply will not find the corresponding button in his profile. Subscribers are people who have previously sent a friend request (but the request was not approved, or approved, but the person was removed from the friends list), or who have subscribed to updates.
If a user wants to see his traffic statistics on VK, but cannot due to an insufficient number of subscribers, he can easily correct the situation. The easiest way is to use third-party services to increase subscribers on social networks. However, there are risks here. For example, in most cases, it is not real people who come to the VK page, but bots, which will soon be deleted by the administration of the social network. This cheating method can also lead to blocking of the user’s page. The second method requires a lot of effort: you need to attract subscribers by publishing interesting content and promoting your page.
How to correctly read account statistics in VK
The most important information about profile visitors is provided in the form of various charts and graphs. This makes the data easier to understand. It is noteworthy that the statistics are generalized. That is, you will not be able to view information for a specific user. You will not see the names, surnames or nicknames of subscribers/guests of the page, but only basic data on their activity. Of course, many users would like to see detailed information about account visitors, but so far this opportunity has not been provided.
Page statistics on VKontakte are also useful for those users who want to increase the popularity of their account, but do not know their target audience. After viewing the statistics, you will receive answers to all your questions. You will immediately understand who is attracted to your personal profile.
By what parameters can you check traffic to a VK page?
As noted above, the statistics of a VKontakte user page consists of three tabs: reach, attendance and activity. Each section presents unique information presented in the form of graphs and diagrams. The graphical representation of the data in linear segments is accompanied by numbers that give a detailed report of how many people visited the page, viewed posts, left feedback, etc.
The following tools are available in the “Attendance” tab to obtain the most detailed information:
Taken together, these parameters provide a complete picture of the profile’s status and popularity. From the data obtained, you can get an idea of all categories of audience visiting the page.